

Blog
Milacron Stockholders Adopt Merger Agreement with Hillenbrand, Inc.
November 20, 2019
CINCINNATI – November 20, 2019 – Milacron Holdings Corp. (NYSE: MCRN) announced today that its stockholders voted to adopt…
Blog
August 28, 2026
Executive Summary
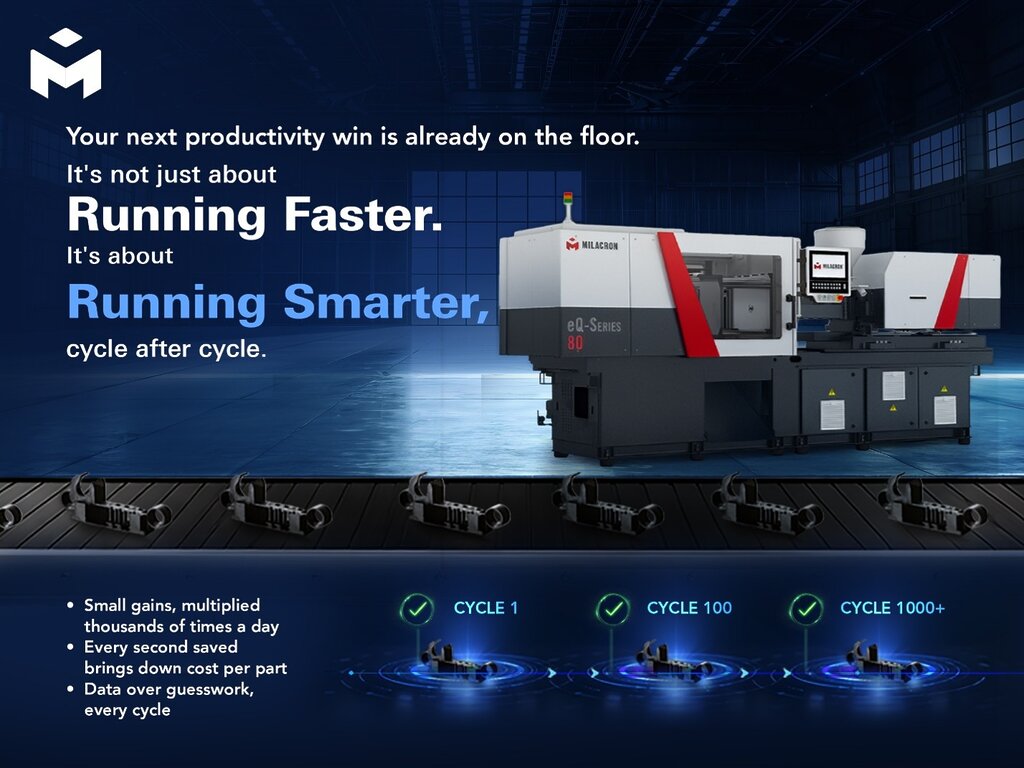
Most manufacturers chase productivity through capital investment — new machines, expanded floor space, added shifts. But the fastest, lowest-risk path to higher throughput often lives inside equipment already on the shop floor: cycle time. This article reframes cycle-time optimization as a strategic, data-driven discipline rather than a shop-floor tweak. Something that directly moves the needle on cost per part, capacity, and delivery reliability without new capital outlay. We outline where the time actually goes, why cooling is usually the biggest lever, and how a structured, data-backed approach turns seconds into sustained margin.
When plant leaders talk about improving productivity, the conversation usually gravitates toward big-ticket items: a new injection molding machine, an additional production line, a robotic work cell. These investments matter, and they have their place in a capacity strategy. But the highest-leverage productivity gain in plastics processing is often the one nobody budgets for: shaving seconds off the production cycle.
Cycle time—the full duration required to produce one finished part—repeats thousands of times a day, across every shift, every week, every quarter. That repetition is exactly what makes it powerful. A two-second reduction sounds trivial in isolation. Multiplied across a year of continuous production, it can represent a meaningful jump in output with zero additional equipment, floor space, or headcount.
For plant managers and operations executives under pressure to grow output while holding capital spending flat, cycle-time optimization deserves a seat at the strategy table—not just the maintenance log.
A production cycle covers every step required to turn raw material into a saleable part: feeding, melting, forming, cooling, ejection, trimming, inspection, and packaging. Each stage adds time, and each stage is a candidate for improvement.
The goal isn’t to run faster—it’s to run at the optimal cycle: the fastest cycle that still holds part quality, dimensional consistency, and process stability. Push too hard on speed alone, and the savings evaporate into scrap, rework, and customer complaints. The manufacturers who win on cycle time aren’t the ones running fastest—they’re the ones running the most consistently.
This is where cycle-time work stops being a shopfloor conversation and becomes a financial one. A small per-cycle reduction compounds across nearly every metric an operations leader is measured on: total output and effective capacity, equipment utilization rates, labor efficiency per part produced, energy consumption per unit, on-time delivery performance, and ultimately, cost per part. Because these metrics are interconnected, a single improvement at the cycle level tends to move several of them at once — which is precisely why cycle time deserves attention alongside more visible capital projects.
The principle is simple, and it’s why it belongs in board-level productivity conversations: every second saved is multiplied by every part produced, for as long as that line runs.
Improvement starts with visibility. Many manufacturers assume the bottleneck is machine speed, when in reality it’s often hiding in supporting activities — material preparation and drying, core processing such as injection or forming, cooling or curing, part removal and handling, inspection and quality checks, and changeovers or mold adjustments. Any one of these can quietly extend total cycle duration well beyond what the core process itself requires.
High-performing operations don’t attack the whole cycle at once. They isolate each stage, measure it independently, and target the true constraint—not the one that’s easiest to see.
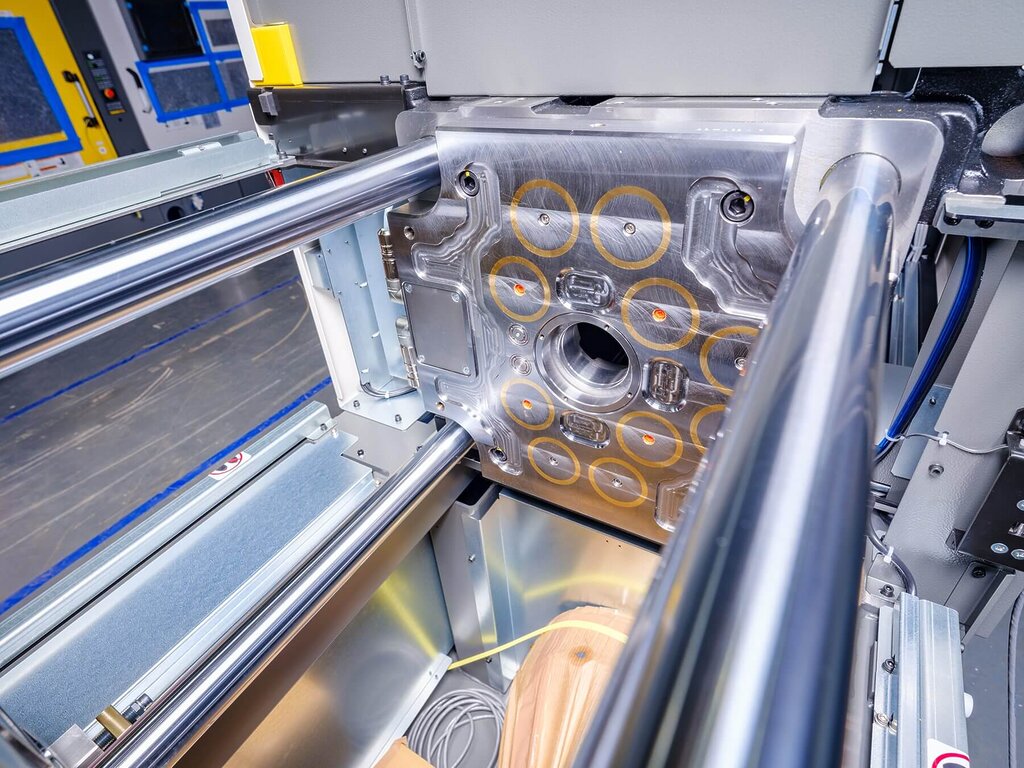
Across plastics processing, cooling frequently consumes the largest single share of total cycle time. A part can’t be ejected or moved downstream until it’s dimensionally stable, and that single dependency makes cooling performance a direct throughput lever.
Manufacturers evaluating this stage typically look at temperature control consistency across the mold, cooling channel design and coolant flow efficiency, tooling geometry and wall-thickness uniformity, material-specific thermal behavior, and process parameter settings. Each of these factors interacts with the others, which is why cooling optimization tends to reward a systematic review rather than a single adjustment in isolation.
Faster cooling isn’t automatically better cooling. Push it too aggressively, and you introduce warpage, internal stress, or dimensional drift—defects that cost far more than the seconds you saved.
It’s tempting to treat “process optimization” and “equipment maintenance” as two different workstreams. In practice, they’re deeply linked. Worn tooling, aging controls, drifting sensors, and mechanical inconsistency all quietly extend cycle time — often disguised as process variation. The warning signs are usually visible well before a breakdown: rising cycle-to-cycle variability, more frequent operator intervention, increasing unplanned downtime, inconsistent part quality across shifts, and longer machine start-up and warm-up periods all point toward the same underlying issue.
What looks like a process problem on the surface is frequently an equipment-performance problem underneath. A well-maintained line is a fundamentally easier line to optimize — which is why modern equipment platforms increasingly build monitoring and diagnostics directly into machine controls, rather than leaving it to periodic manual checks.
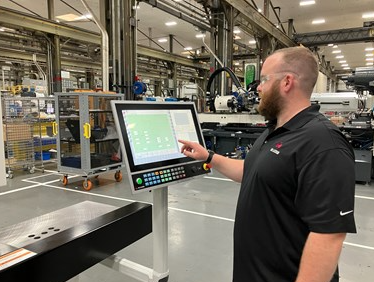
Cycle-time improvement used to rely almost entirely on operator experience and trial-and-error tuning. That expertise still matters — but it’s no longer the only tool available. Smart manufacturing platforms and connected machine controls now give plants direct visibility into actual cycle duration on a cycle-by-cycle basis, process variation and drift over time, downtime events and their root causes, real-time throughput and OEE performance, quality trend data tied back to specific process parameters, and equipment utilization across the full production schedule.
This is where Industry 4.0 stops being a buzzword and becomes a margin strategy. Instead of adjusting based on instinct, teams can validate every change against measured performance data — turning cycle optimization into a repeatable, auditable process rather than a one-time project.
For teams unsure where to start, a practical sequence works well:
One of the most persistent misconceptions in manufacturing is that the shortest cycle wins. It doesn’t. Push cycle time too hard and the risks compound quickly — higher scrap rates, increased rework, accelerated tooling wear, greater equipment stress, and process instability across shifts all tend to appear together once a line is pushed past its stable operating window.
A slightly slower cycle that reliably produces conforming parts will outperform a faster cycle that generates inconsistent output — every time, once scrap and rework are factored in. Leading operations evaluate cycle-time initiatives against quality metrics simultaneously, not as a follow-up check.
Why Continuous Improvement Beats the Big Swing
Dramatic cycle-time reductions rarely come from one initiative. They accumulate from a series of smaller, disciplined changes — incremental process refinements, preventive maintenance upgrades, tooling and mold design improvements, operator training and standardized work, selective automation, and better real-time process monitoring, layered on top of one another over time.
Individually, each change looks modest. Collectively, they build capacity, reduce operating cost, and improve delivery reliability — without a capital request. This is the continuous-improvement mindset that separates plants scaling profitably from plants treading water on the same footprint.
Every production cycle is a small, repeatable opportunity to improve the business. While new equipment and automation will always have a role in a capacity strategy, the cumulative value of optimizing the cycle already running on your floor is frequently underestimated — and it’s available now, without a capital budget cycle.
Cycle time touches throughput, capacity, energy cost, labor efficiency, equipment utilization, and ultimately, margin. The objective isn’t raw speed. It’s building a process that is efficient, stable, repeatable, and built to deliver consistent quality — cycle after cycle.
Viewed that way, cycle optimization isa strategic lever measured in seconds that compounds into a real competitive advantage.
FAQs
1. What is cycle time in injection molding and plastics processing? Cycle time is the total elapsed time to produce one finished part, covering every stage from material feed and melting through forming, cooling, ejection, and inspection. It’s typically measured in seconds and is a core throughput metric for any plastics manufacturing operation.
2. How much can reducing cycle time actually improve output? Because cycle time repeats continuously across a production run, even small reductions compound significantly over a shift, week, or year. The exact gain depends on cycles per day and the size of the reduction — but the underlying math means seconds saved translate directly into additional saleable output without added equipment.
3. Why is cooling time the biggest opportunity in most cycle-time optimization projects? Cooling typically represents the largest single share of total cycle time because parts must reach dimensional stability before ejection or downstream handling. Improvements to mold cooling design, coolant flow, and thermal consistency often yield the largest gains — provided they don’t compromise part quality.
4. Does reducing cycle time hurt part quality? It can, if pursued without discipline. Aggressive speed increases without corresponding process validation often raise scrap rates, rework, and tooling wear. The most effective programs treat speed and quality as a single objective, testing and validating every change against both metrics before locking it in.
Key Takeaways
Blog
November 20, 2019
CINCINNATI – November 20, 2019 – Milacron Holdings Corp. (NYSE: MCRN) announced today that its stockholders voted to adopt…
Blog
January 14, 2021
Milacron launching a new rental option through our exclusive financing partner, Equipment Finance Group (EFG). Milacron, a…
Blog
November 2, 2020
Cincinnati, OH – November 2, 2020 – Milacron, a leading industrial technology company serving the plastics processing…